Fig. 6
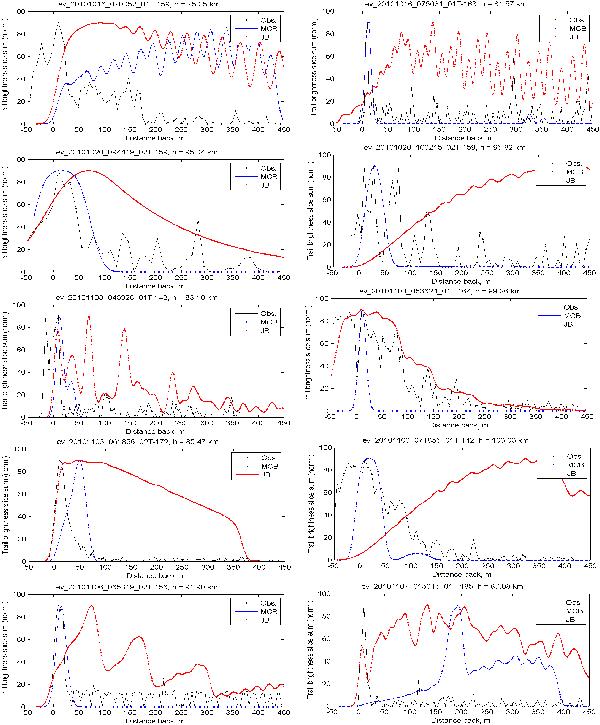
Observed and predicted brightness profiles at the lowest observed height. The red line labelled JB is the thermal erosion model; the blue line labelled MCB is the thermal disruption model. Note that, in several cases, models consistent with the observations in this lowest height are not consistent at some earlier point in the trail.
Current usage metrics show cumulative count of Article Views (full-text article views including HTML views, PDF and ePub downloads, according to the available data) and Abstracts Views on Vision4Press platform.
Data correspond to usage on the plateform after 2015. The current usage metrics is available 48-96 hours after online publication and is updated daily on week days.
Initial download of the metrics may take a while.