Fig. 4
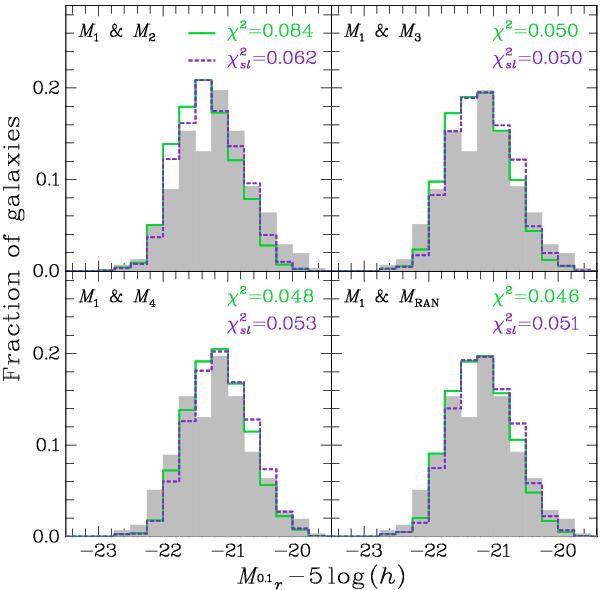
Distributions of BCG absolute magnitudes. Shaded areas: BCGs in the EQL CG sample. We show in the continuous green line the distribution of absolute magnitudes resulting from the combined luminosity of the EQL LG BCG and: the second brightest galaxy in the group (top left panel); the third brightest galaxy (top right panel); the fourth brightest galaxy (bottom left panel); and a galaxy randomly chosen among the 2nd-, 3rd- and 4th-ranked galaxies. The distributions shown in the dashed violet line, are similar to the green ones, but we allow for an up to 30% randomly chosen fraction of stars to be lost in the merging process. We quote in each panel the χ2 statistics of the comparison between the models and the shaded distribution.
Current usage metrics show cumulative count of Article Views (full-text article views including HTML views, PDF and ePub downloads, according to the available data) and Abstracts Views on Vision4Press platform.
Data correspond to usage on the plateform after 2015. The current usage metrics is available 48-96 hours after online publication and is updated daily on week days.
Initial download of the metrics may take a while.