Fig. 9
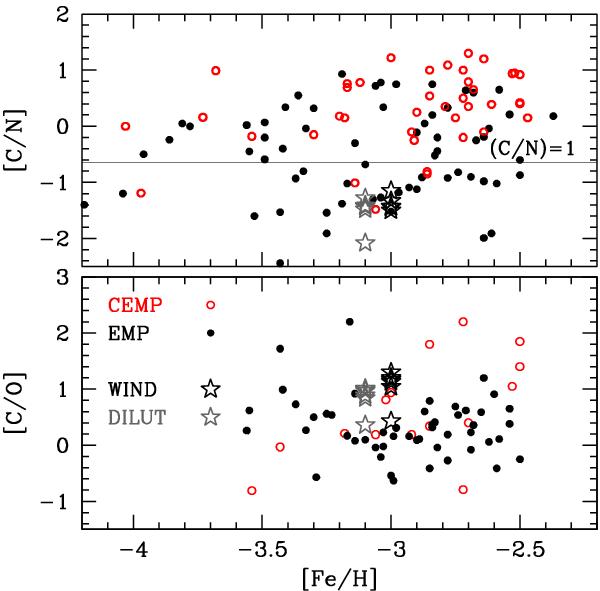
[C/N] (upper panel) and [C/O] (lower panel) versus metallicity. Black symbols correspond to the yields of our computed models. The cases in which dilution has been taken into account are represented in grey. They should be located at the same [Fe/H] as the non-diluted yields, but we displaced them –0.1 dex for the sake of clarity. For comparison, observational data of EMP (black solid circles) and CEMP (red open circles) from the SAGA database are represented in both panels.
Current usage metrics show cumulative count of Article Views (full-text article views including HTML views, PDF and ePub downloads, according to the available data) and Abstracts Views on Vision4Press platform.
Data correspond to usage on the plateform after 2015. The current usage metrics is available 48-96 hours after online publication and is updated daily on week days.
Initial download of the metrics may take a while.