Fig. 2
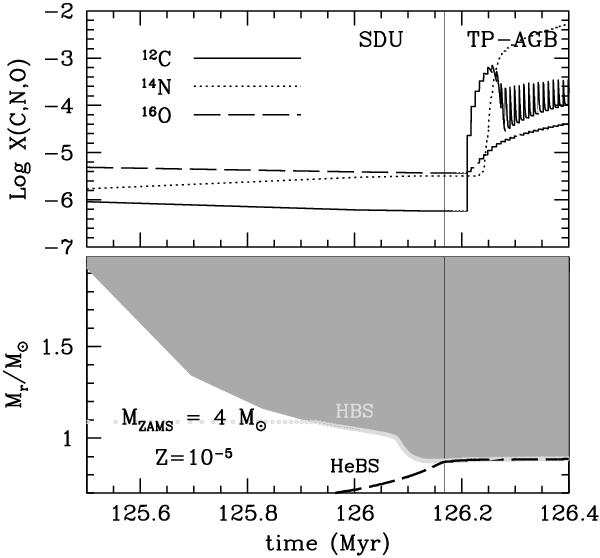
Upper panel: evolution of surface abundances of carbon, nitrogen and oxygen during the second dredge-up episode (SDU) and the first thermal pulses of the TP-AGB phase for the 4 M⊙ model. Lower panel: evolution of the advance of the base of the convective envelope (grey shading) during the same interval of time. The light grey and the black dashed lines represent the location of the H-burning shell (HBS) and the He-burning shell (HeBS) respectively. The vertical line marks the beginning of the TP-AGB phase at the onset of the first thermal pulse.
Current usage metrics show cumulative count of Article Views (full-text article views including HTML views, PDF and ePub downloads, according to the available data) and Abstracts Views on Vision4Press platform.
Data correspond to usage on the plateform after 2015. The current usage metrics is available 48-96 hours after online publication and is updated daily on week days.
Initial download of the metrics may take a while.