Fig. 9
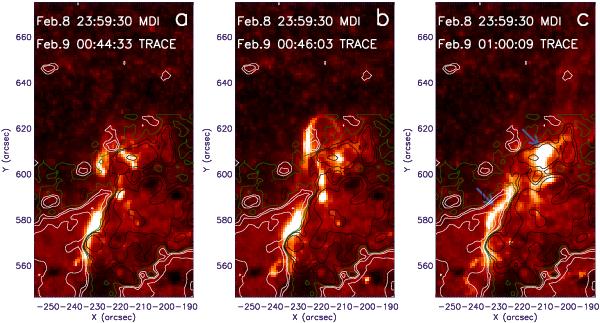
A sequence of TRACE 1600 Å images with the SOHO/MDI magnetograms at 23:59:30 UT on Feb. 8 superimposed. The solid white and the black lines are the contours of the positive and the negative magnetic fields, respectively. The levels of the contours of the magnetic fields are ± 50 G, ± 100 G, and ± 300 G. The green lines denote the polarity inversion lines. Two blue arrows indicate the two flare ribbons.
Current usage metrics show cumulative count of Article Views (full-text article views including HTML views, PDF and ePub downloads, according to the available data) and Abstracts Views on Vision4Press platform.
Data correspond to usage on the plateform after 2015. The current usage metrics is available 48-96 hours after online publication and is updated daily on week days.
Initial download of the metrics may take a while.