Fig. 7
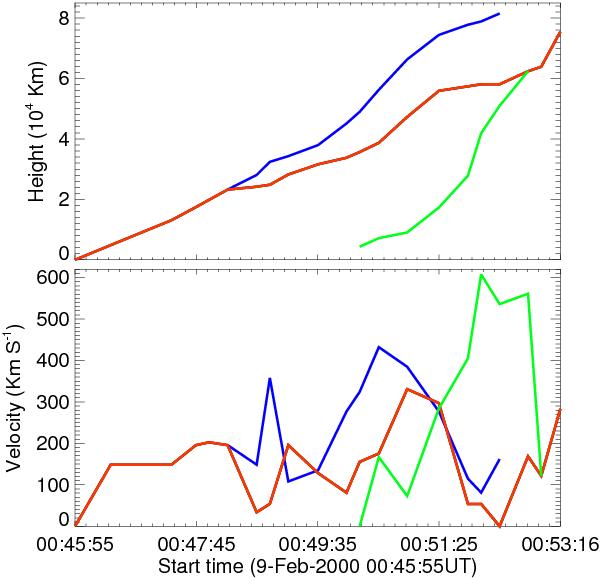
Height (upper panel) and the velocity (lower panel) of the bright strand (P1) (red line), the bright strand (P3) (blue line), and the main filament (F3) (green line) as a function of time, as measured from 171 Å images along the dashed lines of Fig. 5. We adopted the average values of three repeated measurements of the height. The velocity is the derivative of the height curve.
Current usage metrics show cumulative count of Article Views (full-text article views including HTML views, PDF and ePub downloads, according to the available data) and Abstracts Views on Vision4Press platform.
Data correspond to usage on the plateform after 2015. The current usage metrics is available 48-96 hours after online publication and is updated daily on week days.
Initial download of the metrics may take a while.