Fig. 7
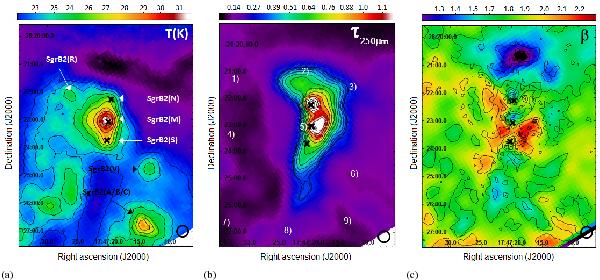
(a) Dust temperature map of the Sgr B2 molecular cloud. (b) Optical depth image at 250 μm. (c) Map of the dust emissivity index, β (see Eq. (2)). The size of the beam (FWHM = 36.9″) is plotted at the down-right side of the images. The size of the images is ~7.0 × 8.22 arcmin2, equivalent to ~17.3 × 20.3 pc2. White numbers on the optical depth image represent the nine positions, whose SED and fitting are shown in Fig. 8.
Current usage metrics show cumulative count of Article Views (full-text article views including HTML views, PDF and ePub downloads, according to the available data) and Abstracts Views on Vision4Press platform.
Data correspond to usage on the plateform after 2015. The current usage metrics is available 48-96 hours after online publication and is updated daily on week days.
Initial download of the metrics may take a while.