Fig. 6
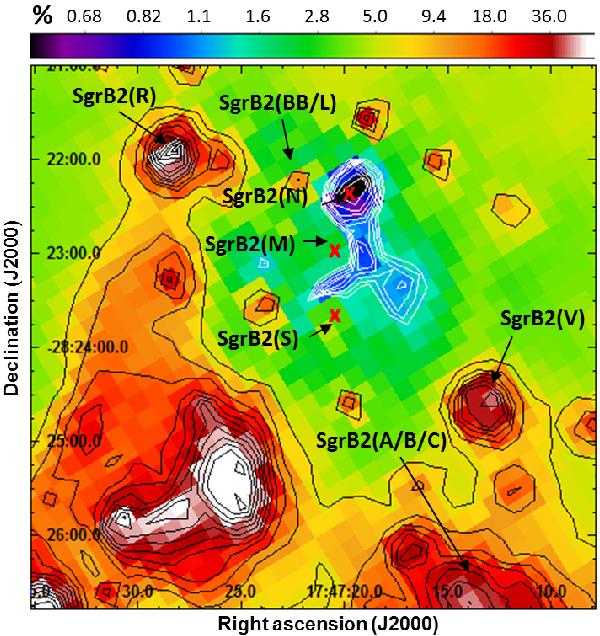
Upper limit to the total contribution of the VSGs emission to the dust thermal radiation at 70 μm calculated as f24 μm/f70 μm × 100. The white contours represent the area with the lowest contribution (<1.8%). Black contours trace the regions with the highest contributions (>8%).
Current usage metrics show cumulative count of Article Views (full-text article views including HTML views, PDF and ePub downloads, according to the available data) and Abstracts Views on Vision4Press platform.
Data correspond to usage on the plateform after 2015. The current usage metrics is available 48-96 hours after online publication and is updated daily on week days.
Initial download of the metrics may take a while.