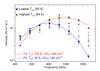
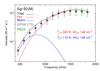
Fig. 15
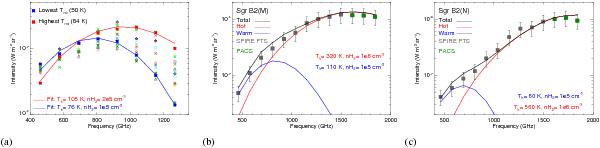
Integrated CO intensities fitted with non-LTE models. a) CO emission rotational ladders at fifteen positions throughout the extended envelope. It shows the fits of the CO rotational ladders at the positions of the highest and the lowest Trot. b) and c) show the CO rotational ladders on Sgr B2(M) b) and Sgr B2(N) c) fitted by the non-LTE model obtained (black line). Blue line represents the contribution from the warm gas, which is distributed throughout the extended envelope. Red line is the contribution of the hot gas associated with the main cores. Grey squares represent the fluxes observed with the SPIRE FTS and the green squares are the fluxes observed with the PACS.
Current usage metrics show cumulative count of Article Views (full-text article views including HTML views, PDF and ePub downloads, according to the available data) and Abstracts Views on Vision4Press platform.
Data correspond to usage on the plateform after 2015. The current usage metrics is available 48-96 hours after online publication and is updated daily on week days.
Initial download of the metrics may take a while.