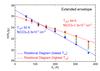
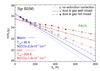
Fig. 14
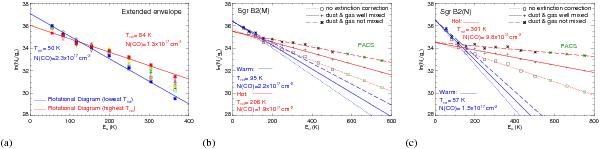
CO rotational diagrams showing the column density per statistical weight versus the energy of the upper level. (a) The CO rotational diagrams measured at fifteen different positions throughout the warm extended envelope of Sgr B2, limited by the highest Trot ~ 84 K (red line) and the lowest Trot ~ 50 K (blue line). The coordinates and the Trot of each diagram are given in Table 2. The CO line intensities throughout the envelope are not corrected for dust extinction. The CO rotational diagrams of Sgr B2(M) (b) and Sgr B2(N) (c) are calculated without extinction correction (dashed line), assuming that gas and dust are well mixed (continuum line) and that the CO emission is arising from the innermost region (dotted line). The diagrams suggest the presence of two temperature components, a warm gas component relative to the extended envelope (blue) and a hot gas component associated with the sources themselves (red).
Current usage metrics show cumulative count of Article Views (full-text article views including HTML views, PDF and ePub downloads, according to the available data) and Abstracts Views on Vision4Press platform.
Data correspond to usage on the plateform after 2015. The current usage metrics is available 48-96 hours after online publication and is updated daily on week days.
Initial download of the metrics may take a while.