Fig. 12
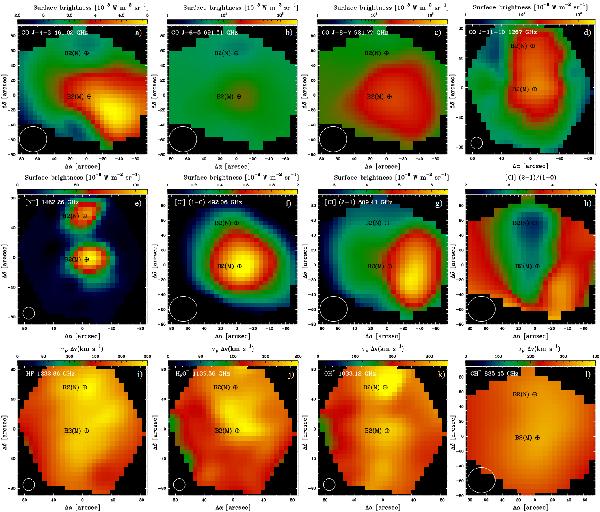
Top: Maps of the CO J = 4–3, J = 6–5, J = 8–7, and J = 11–10 lines. Center: Maps of the emission lines [NII], [CI] (1–0), [CI] (2–1), and [CI] (2–1)/(1–0). Bottom: Velocity-integrated optical depth maps of the absorption spectral lines: HF, H2O+, OH+, and CH+. The total area of each map is ~3.5 × 3.5 arcmin2. The maps have a pixel size of 9.5″. The maps observed with the SLW detector (ν < 970 GHz) have a FWHM ~ 30″ and those observed with the SSW detector (ν > 970 GHz) have a FWHM ~ 18″. All the maps are centered at the position of Sgr B2(M).
Current usage metrics show cumulative count of Article Views (full-text article views including HTML views, PDF and ePub downloads, according to the available data) and Abstracts Views on Vision4Press platform.
Data correspond to usage on the plateform after 2015. The current usage metrics is available 48-96 hours after online publication and is updated daily on week days.
Initial download of the metrics may take a while.