Fig. 2
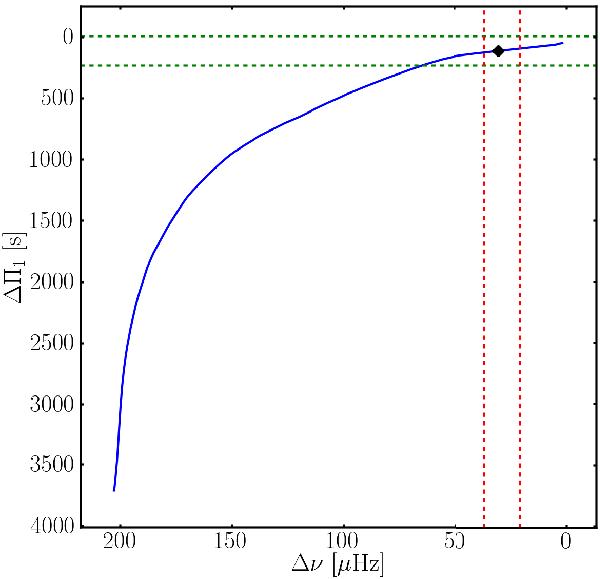
Evolutionary track of the 0.84 M⊙ model in the asteroseismic H.-R. diagram (blue). The black diamond indicates the position of the selected model. The dashed red and green lines correspond to the errors bars on the observed large separation and period spacing, respectively, from Deheuvels et al. (2012). These error bars have been magnified 40 times for the large separation and 400 times for the period spacing to be visible.
Current usage metrics show cumulative count of Article Views (full-text article views including HTML views, PDF and ePub downloads, according to the available data) and Abstracts Views on Vision4Press platform.
Data correspond to usage on the plateform after 2015. The current usage metrics is available 48-96 hours after online publication and is updated daily on week days.
Initial download of the metrics may take a while.