Fig. 5
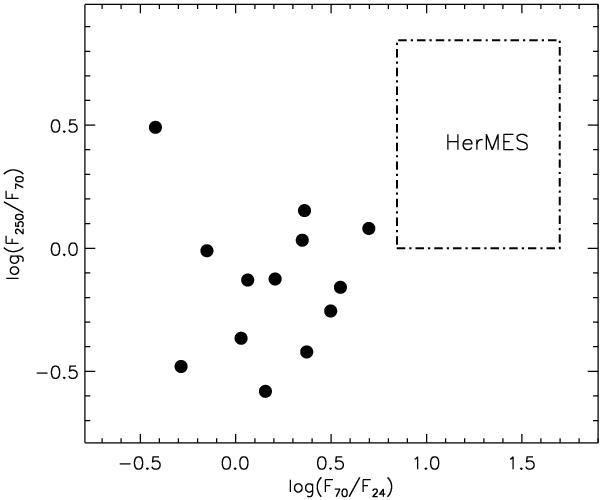
log (F250/F70) vs. log (F70/F24) color–color diagram. The filled circles are YSOs in Cha II; their MIPS-24 μm fluxes were retrieved from the Spitzer-c2d catalog (Alcalá et al. 2008). The dot-dashed line indicates the locus of AGNs in the Herschel-HerMES survey (Hatziminaoglou et al. 2010).
Current usage metrics show cumulative count of Article Views (full-text article views including HTML views, PDF and ePub downloads, according to the available data) and Abstracts Views on Vision4Press platform.
Data correspond to usage on the plateform after 2015. The current usage metrics is available 48-96 hours after online publication and is updated daily on week days.
Initial download of the metrics may take a while.