Fig. 1
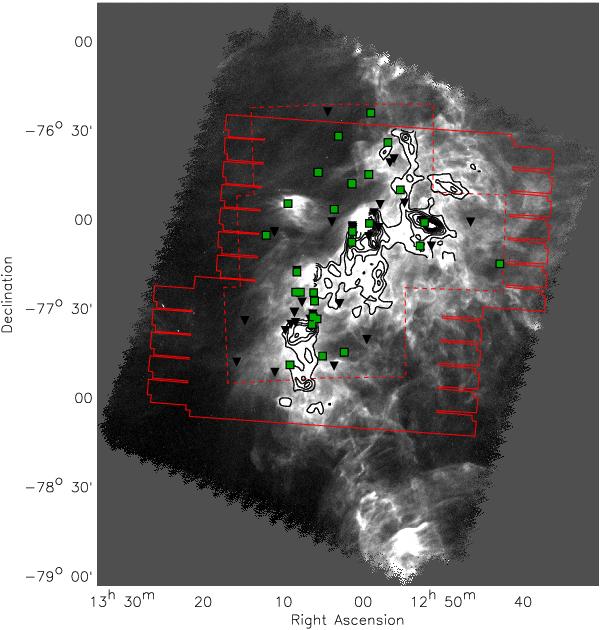
SPIRE-250 μm map of Cha II. The continuous and dashed lines highlight the areas previously mapped in the infrared with Spitzer (Alcalá et al. 2008) and in the optical with ESO-2.2.m/WFI (Spezzi et al. 2007), respectively. The squares are the YSOs detected with the HGBS (Table 2). The triangles indicate the position of previously known YSOs not detected with the HGBS (Table 3). The contours from the Spitzer/IRAC extinction map (Alcalá et al. 2008) are also shown.
Current usage metrics show cumulative count of Article Views (full-text article views including HTML views, PDF and ePub downloads, according to the available data) and Abstracts Views on Vision4Press platform.
Data correspond to usage on the plateform after 2015. The current usage metrics is available 48-96 hours after online publication and is updated daily on week days.
Initial download of the metrics may take a while.