Free Access
Fig. 6
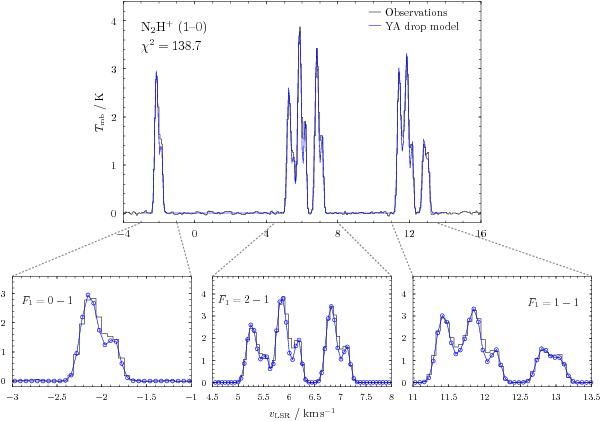
Observed N2H+(1−0) spectrum in L1544 modelled with non-LTE code MOLLIE. The black histograms show our observation data. The blue curve shows the model spectrum computed using the “altered” dark cloud model and the N2H+ radial abundance profile of Aikawa et al. (2011).
Current usage metrics show cumulative count of Article Views (full-text article views including HTML views, PDF and ePub downloads, according to the available data) and Abstracts Views on Vision4Press platform.
Data correspond to usage on the plateform after 2015. The current usage metrics is available 48-96 hours after online publication and is updated daily on week days.
Initial download of the metrics may take a while.