Fig. 4
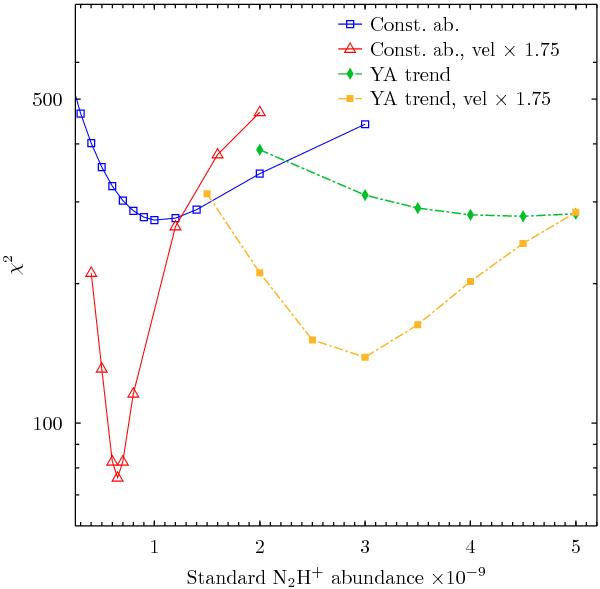
Weighted χ2 of the N2H+(1−0) modellings using different standard dyazenilium abundances and radial profiles. Blue curve: constant N2H+ abundance with respect to H2; red curve: constant abundance and modified cloud infall velocity (see text). Green curve: radial N2H+ abundance profile shown in Fig. 3; yellow curve: radial profile with modified cloud infall velocity.
Current usage metrics show cumulative count of Article Views (full-text article views including HTML views, PDF and ePub downloads, according to the available data) and Abstracts Views on Vision4Press platform.
Data correspond to usage on the plateform after 2015. The current usage metrics is available 48-96 hours after online publication and is updated daily on week days.
Initial download of the metrics may take a while.