Fig. 3
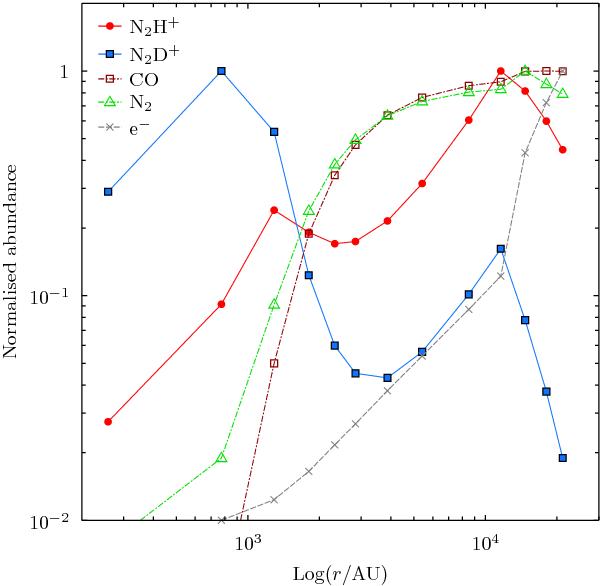
Abundance trends (normalised to the maximum values) predicted by the Aikawa et al. (2011) models for dyazenilium and chemically related species. The N2H+ abundance decreases toward the cloud centre following the N2 freeze-out (green curve) onto dust mantels at high gas density. The concomitant steeper drops of free electron (grey curve) and CO (brown curve) give rise to the N2H+ abundance maxima at radii of ~104 and ~103 astronomical units. N2D+ shows similar behaviour (blue curve), but it features a much stronger inner peak owing to the strong deuterium fractionation existing in the highly-CO depleted central region.
Current usage metrics show cumulative count of Article Views (full-text article views including HTML views, PDF and ePub downloads, according to the available data) and Abstracts Views on Vision4Press platform.
Data correspond to usage on the plateform after 2015. The current usage metrics is available 48-96 hours after online publication and is updated daily on week days.
Initial download of the metrics may take a while.