Free Access
Fig. 9
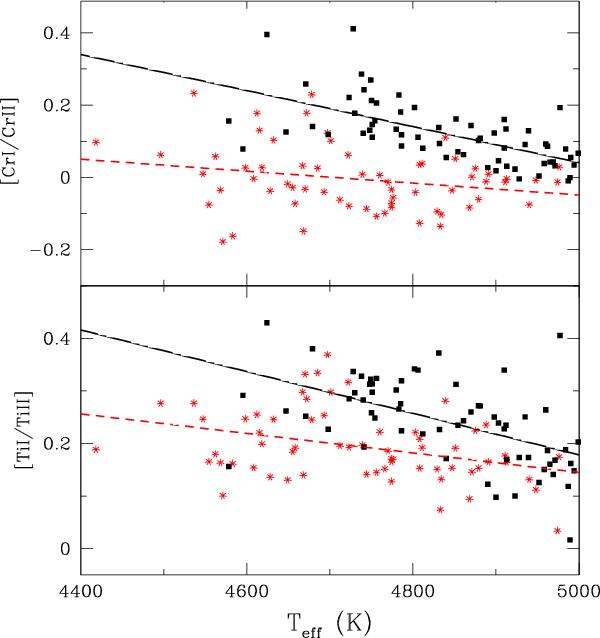
[Cr i/Cr ii] and [Ti i/Ti ii] as a function of effective temperature. The black squares and red asterisks correspond to the abundance ratios derived using old and new stellar parameters, respectively. The solid and dashed lines depict the linear fits of the data.
Current usage metrics show cumulative count of Article Views (full-text article views including HTML views, PDF and ePub downloads, according to the available data) and Abstracts Views on Vision4Press platform.
Data correspond to usage on the plateform after 2015. The current usage metrics is available 48-96 hours after online publication and is updated daily on week days.
Initial download of the metrics may take a while.