Fig. 5
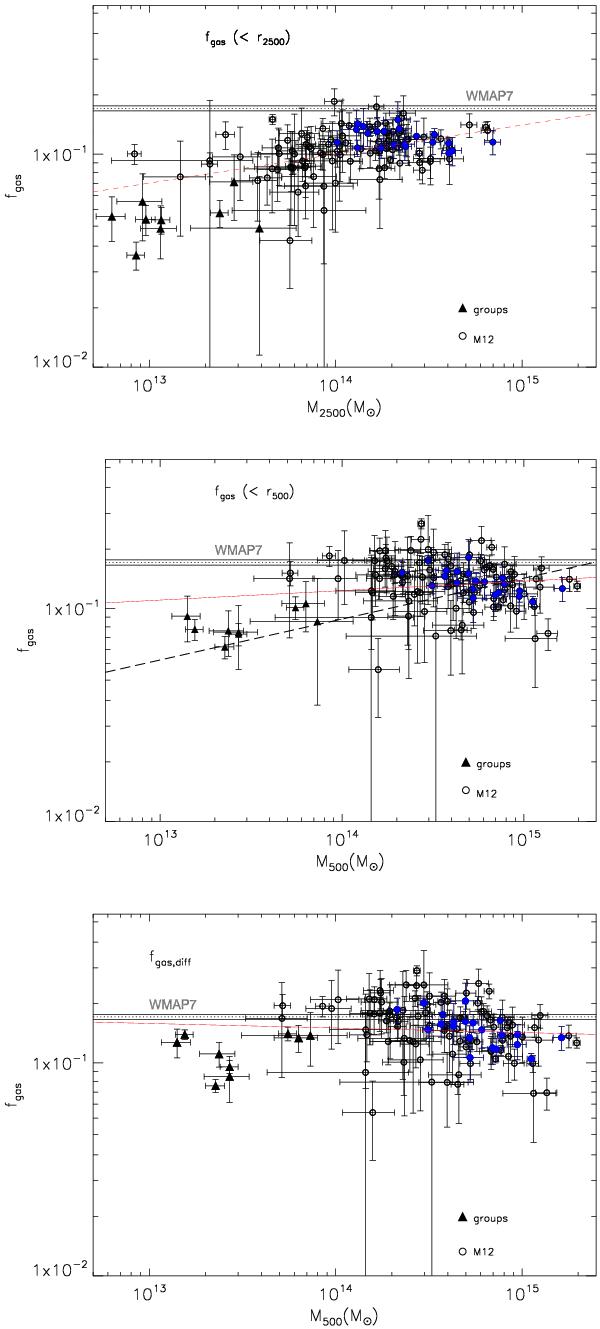
Gas mass fraction as a function of total mass computed within r2500 (upper panel), and within r500 (middle panel); the differential gas mass fraction, [Mgas,500 − Mgas,2500]/[Mtot,500 − Mtot,2500], as a function of Mtot,500 (lower panel). The triangles represent the nine groups, while the circles represent the 114 clusters from M12 (we show in blue the strong cool-core clusters). The red lines show the best fits for the entire sample. The dashed line in the middle panel corresponds to the best fit found by Laganá et al. (2011).
Current usage metrics show cumulative count of Article Views (full-text article views including HTML views, PDF and ePub downloads, according to the available data) and Abstracts Views on Vision4Press platform.
Data correspond to usage on the plateform after 2015. The current usage metrics is available 48-96 hours after online publication and is updated daily on week days.
Initial download of the metrics may take a while.