Fig. 4
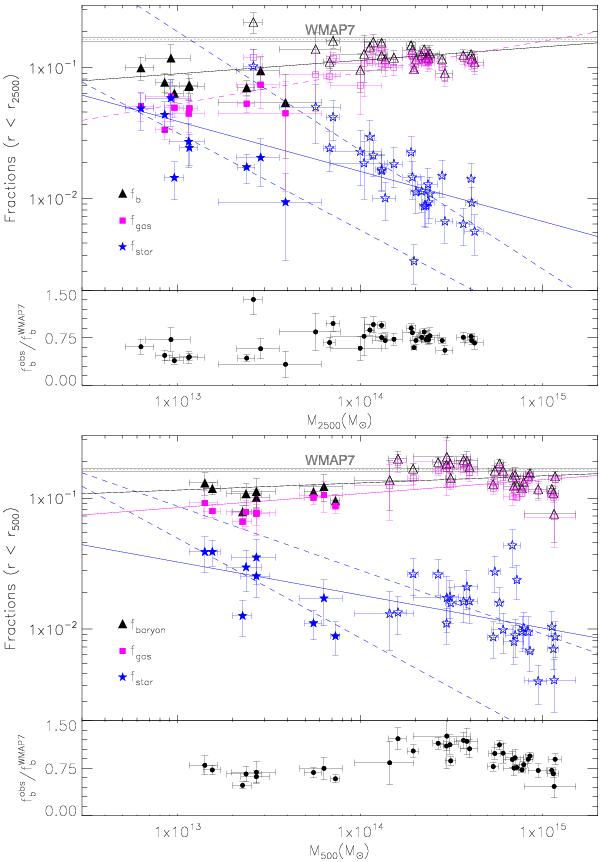
Stellar (blue stars), gas (magenta squares), and total baryon (black triangles) mass fractions as a function of total mass for r2500 (top panel) and r500 (lower panel). The solid lines correspond to the best linear fit for each relation. The two blue dashed lines correspond to the fits for the groups and clusters separately. On the bottom of each panel, we show the ratio between the total baryon fraction determined by the sum of fstar and fgas and the WMAP-7 value as a function of total mass.
Current usage metrics show cumulative count of Article Views (full-text article views including HTML views, PDF and ePub downloads, according to the available data) and Abstracts Views on Vision4Press platform.
Data correspond to usage on the plateform after 2015. The current usage metrics is available 48-96 hours after online publication and is updated daily on week days.
Initial download of the metrics may take a while.