Fig. 3
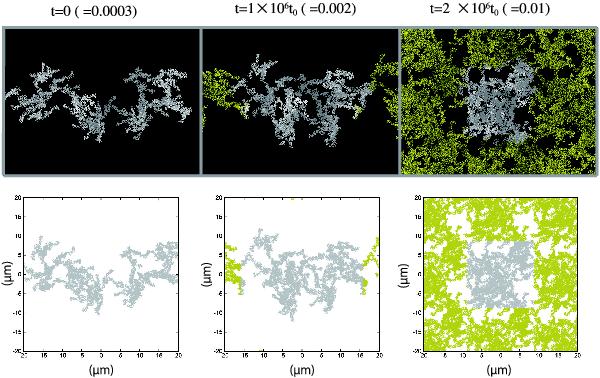
Snapshots of the evolution of an aggregate under compression in the case of N = 16 384. The top three figures are 3D visualizations. They have the same scale with different time epochs. The white particles are inside a box enclosed by the periodic boundaries. The yellow particles are in neighboring boxes to the box of white particles. For visualization, we do not draw the copies on the back and front sides of the boundaries but only 8 copies of the white particles across the boundaries. Each bottom figure represents projected positions onto 2D plane of all particles in each corresponding top figure. The gray points in the bottom figures correspond to the positions of the white particles in the top figures, and the yellow points correspond to those of the yellow particles in the top figures. Scales are in μm.
Current usage metrics show cumulative count of Article Views (full-text article views including HTML views, PDF and ePub downloads, according to the available data) and Abstracts Views on Vision4Press platform.
Data correspond to usage on the plateform after 2015. The current usage metrics is available 48-96 hours after online publication and is updated daily on week days.
Initial download of the metrics may take a while.