Fig. 14
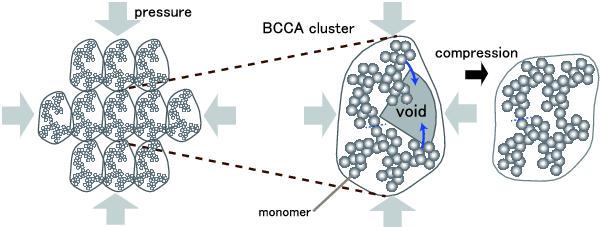
Schematic drawing of compression of a dust aggregate consisting of a number of BCCA clusters. The left figure shows a dust aggregate consisting of many BCCA clusters and the BCCA clusters are distributed three dimensionally. Each enclosed line represents each region dominated by the BCCA clusters. The central figure is a BCCA cluster, receiving pressure from the next clusters. The BCCA cluster has a large void depicted in the central figure, and thus the void would be compressed, as expressed in the right figure. The required energy to compress the void is the energy to rotate the connection of monomers in contact. Therefore, the compression can be determined by the rolling motion of monomer connection on the connecting point of the subclusters.
Current usage metrics show cumulative count of Article Views (full-text article views including HTML views, PDF and ePub downloads, according to the available data) and Abstracts Views on Vision4Press platform.
Data correspond to usage on the plateform after 2015. The current usage metrics is available 48-96 hours after online publication and is updated daily on week days.
Initial download of the metrics may take a while.