Fig. 13
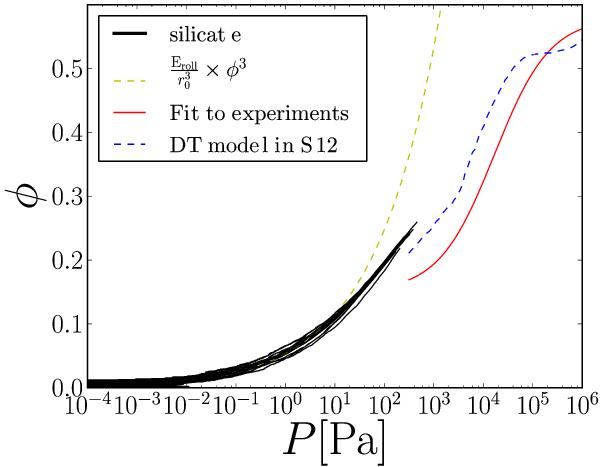
The filling factor φ against pressure P in [Pa]. This figure is same as Fig. 12, but plotted with a linear scale of φ and reversal of xy axis to compare with previous studies (see Fig. 4 in Seizinger et al. 2012). The dotted line is the result of numerical simulations in the high-density region (φ ≳ 0.1) in Seizinger et al. (2012) and the thin solid line is the fitting formula proposed by Güttler et al. (2009). Our results consistently connect to the previous simulations in the high-density region.
Current usage metrics show cumulative count of Article Views (full-text article views including HTML views, PDF and ePub downloads, according to the available data) and Abstracts Views on Vision4Press platform.
Data correspond to usage on the plateform after 2015. The current usage metrics is available 48-96 hours after online publication and is updated daily on week days.
Initial download of the metrics may take a while.