Fig. 11
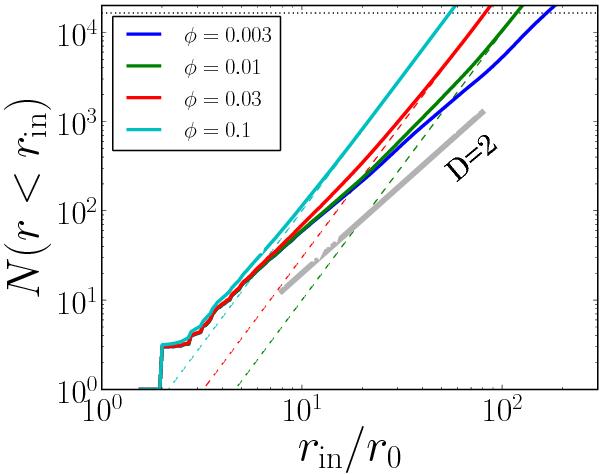
Number of particles inside the radius rin against normalized radius rin/r0. This figure represents the fractal structure of the compressed aggregates in our simulation for various φ. We set a particle as an origin and count the number of particles inside r < rin, where r is the distance from the origin to each particle’s center. Then we count the same correlation of all particles as an origin and take their average (similar figure of Fig. 7 in the paper of Wada et al. 2008). Each line shows the result at the different time steps. The solid thick lines represents the structure of fractal dimension D = 2, and dashed lines represent D = 3 for each corresponding φ. The dotted line shows the number of particles in calculation. The region below this line corresponds to inside the periodic boundaries.
Current usage metrics show cumulative count of Article Views (full-text article views including HTML views, PDF and ePub downloads, according to the available data) and Abstracts Views on Vision4Press platform.
Data correspond to usage on the plateform after 2015. The current usage metrics is available 48-96 hours after online publication and is updated daily on week days.
Initial download of the metrics may take a while.