Fig. 1
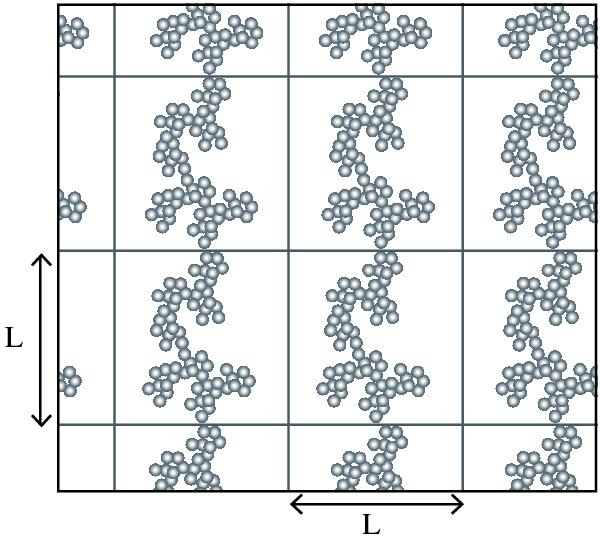
Schematic drawing of the periodic boundary condition. Each box illustrates a boundary box with a side length L for all directions. When the boundary starts to get closer, the aggregate sticks to the neighboring aggregates over the boundary and is compressed by them. It should be noted that this picture is illustrated in the 2D direction, but our simulations are performed in 3D.
Current usage metrics show cumulative count of Article Views (full-text article views including HTML views, PDF and ePub downloads, according to the available data) and Abstracts Views on Vision4Press platform.
Data correspond to usage on the plateform after 2015. The current usage metrics is available 48-96 hours after online publication and is updated daily on week days.
Initial download of the metrics may take a while.