Fig. 6
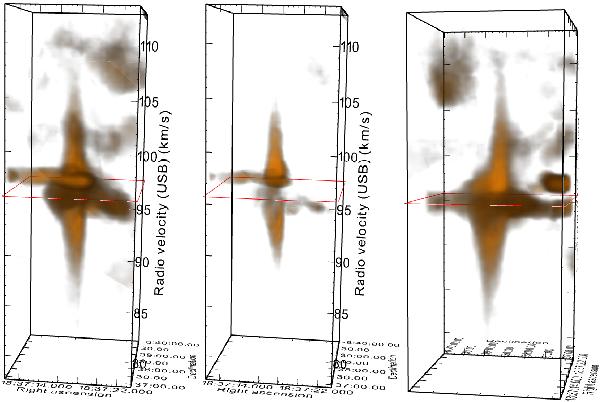
12CO (J = 3−2) spectral cubes covering a 3.3′ × 3.3′ field surrounding IRAS 18345 in a velocity range 77.6 km s-1 to 113.5 km s-1 centred on the CO-line rest frequency. The left and right panels show the spectral cube in two different orientations. The central panel shows the same region as in the left panel, but with the faint emission filtered out to show the outflow more clearly. The red square shows the plane of the υLSR of the core. The contours representing the blue- and red-shifted outflow lobes projected on to the sky plane are shown in Fig. 1.
Current usage metrics show cumulative count of Article Views (full-text article views including HTML views, PDF and ePub downloads, according to the available data) and Abstracts Views on Vision4Press platform.
Data correspond to usage on the plateform after 2015. The current usage metrics is available 48-96 hours after online publication and is updated daily on week days.
Initial download of the metrics may take a while.