Fig. 1
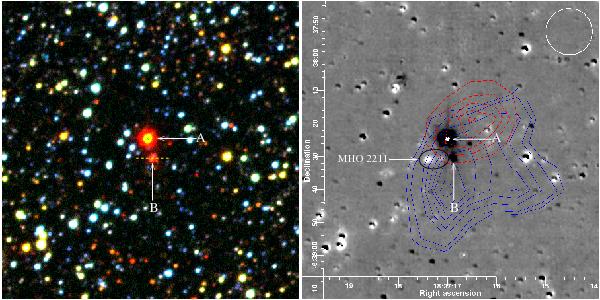
Left panel: WFCAM JHK colour-composite image (J-blue, H-green, K-red). Right panel: continuum-subtracted H2 image, smoothed with a Gaussian of FWHM = 2 pix, and averaged over all our observations. The images are constructed from our new WFCAM data, and cover a filed of view of 1.5′ × 1.5′. The dashed yellow line on the JHK image shows the location and direction of the major axis (length ×50) of the elliptical distribution of the 6.7 GHz methanol maser spots detected by Bartkiewicz et al. (2009). The blue (continuous) and red (dashed) contours overlaid on the H2 image show the deconvolved blue- and red-shifted lobes of the outflow detected in CO (J = 3−2), see Sect. 2.3.1; the blue contours are at 3, 5, 10, 15, 20, 25, 30 and 40σ, and the red contours are at 3, 5, 7, 9, and 11σ above the mean background. The H2 line emission features are enclosed in ellipse and labelled “MHO 2211”. The white circle on the top-right corner shows the JCMT beam size (14.6′′ at 345 GHz).
Current usage metrics show cumulative count of Article Views (full-text article views including HTML views, PDF and ePub downloads, according to the available data) and Abstracts Views on Vision4Press platform.
Data correspond to usage on the plateform after 2015. The current usage metrics is available 48-96 hours after online publication and is updated daily on week days.
Initial download of the metrics may take a while.