Fig. 6
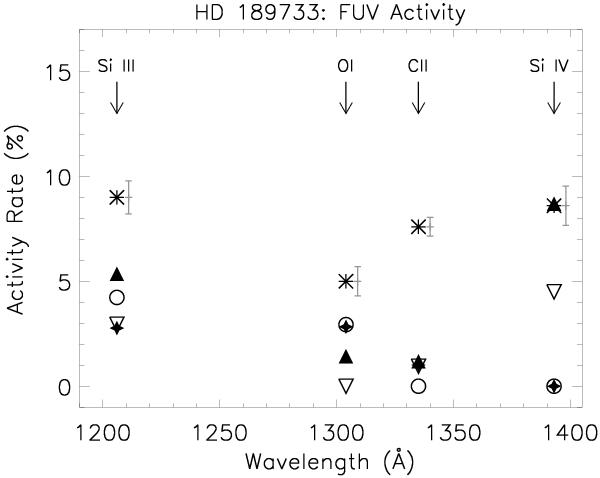
HD 189733 activity at key species emission lines versus HST orbits during the 5-h duration of the HST/COS G130M program used in this study. The solar flare activity is taken from Table 3. Open circles denote HST orbit 1, inverted open triangles orbit 2, filled triangles orbit 3, diamonds orbit 4, and stars the solar medium flare activity. The corresponding statistical noise levels are shown as gray error bars.
Current usage metrics show cumulative count of Article Views (full-text article views including HTML views, PDF and ePub downloads, according to the available data) and Abstracts Views on Vision4Press platform.
Data correspond to usage on the plateform after 2015. The current usage metrics is available 48-96 hours after online publication and is updated daily on week days.
Initial download of the metrics may take a while.