Fig. 3
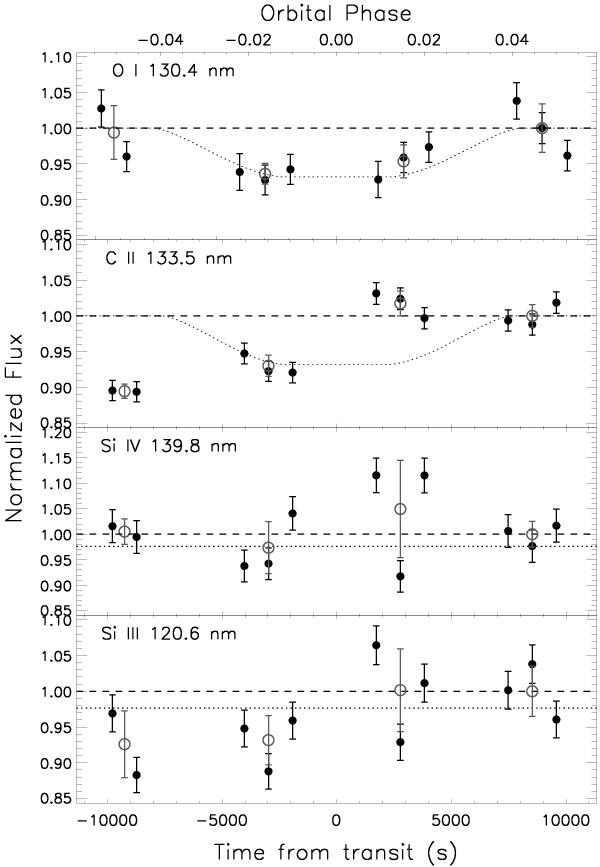
HD 189733b transit light curves obtained for selected spectral lines versus time (or orbital phase): O I (130.4 nm) triplet, C II (133.5 nm) doublet, Si III (120.6 nm), and Si IV (139.8 nm) lines. Usually, those lines are used as a diagnostic of solar flux variability in the FUV (Brekke et al. 1996). A synthetic light curve corresponding to an occulting disk of ~ 1.7 Rp is shown with C II and O I data points. Dark error bars are statistical while the gray bars include the non-statistical scatter of the stellar signal within the given HST orbit.
Current usage metrics show cumulative count of Article Views (full-text article views including HTML views, PDF and ePub downloads, according to the available data) and Abstracts Views on Vision4Press platform.
Data correspond to usage on the plateform after 2015. The current usage metrics is available 48-96 hours after online publication and is updated daily on week days.
Initial download of the metrics may take a while.