Fig. 3
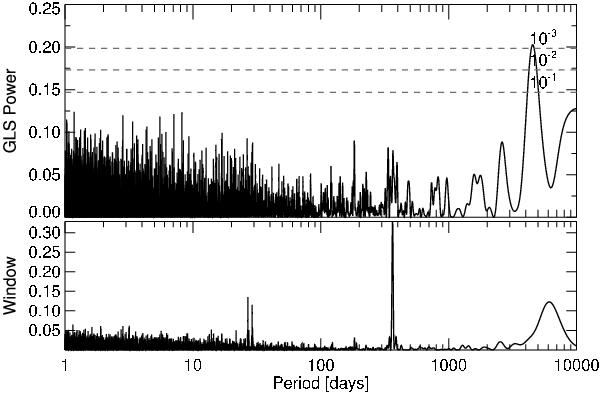
Generalized Lomb-Scargle periodogram and window function. The computed periodogram (upper plot) is a convolution of the astrophysical signal and the sampling function (window function, lower plot). The periodogram is obtained from the sigma-clipped, bin-averaged dataset. The horizontal dashed lines indicate FAP levels of 10–1, 10–2, and 10–3. There is one significant peak at a period of 12.34 years with an FAP of 6.8 × 10⁻⁴. The window function shows a significant peak at 365 days that is caused by the seasonal visibility of the source. Significant alias peaks caused by the sampling period are absent in the GLS periodogram.
Current usage metrics show cumulative count of Article Views (full-text article views including HTML views, PDF and ePub downloads, according to the available data) and Abstracts Views on Vision4Press platform.
Data correspond to usage on the plateform after 2015. The current usage metrics is available 48-96 hours after online publication and is updated daily on week days.
Initial download of the metrics may take a while.