Fig. 2
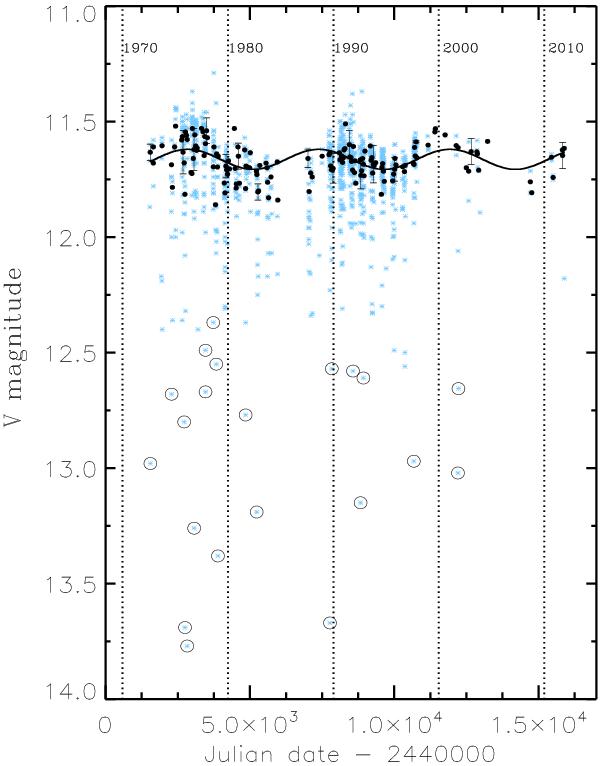
Light curve of RZ Psc over 40 years. More than one thousand measurements are plotted (small blue stars). Gaps in the measurement coverage are caused by the seasonal observability of the object. The deepest minima (ΔV > 1) are marked with open circles. Additionally, the flux at bright phases varies periodically. This periodicity is revealed by sigma-clipping and time-binning the data, resulting in the points represented by black circles, whose 12.44-year period is marked by the sinusoid (see text). Typical uncertainties in the clipped-binned data are indicated only in 10% of the plotted points.
Current usage metrics show cumulative count of Article Views (full-text article views including HTML views, PDF and ePub downloads, according to the available data) and Abstracts Views on Vision4Press platform.
Data correspond to usage on the plateform after 2015. The current usage metrics is available 48-96 hours after online publication and is updated daily on week days.
Initial download of the metrics may take a while.