Fig. 1
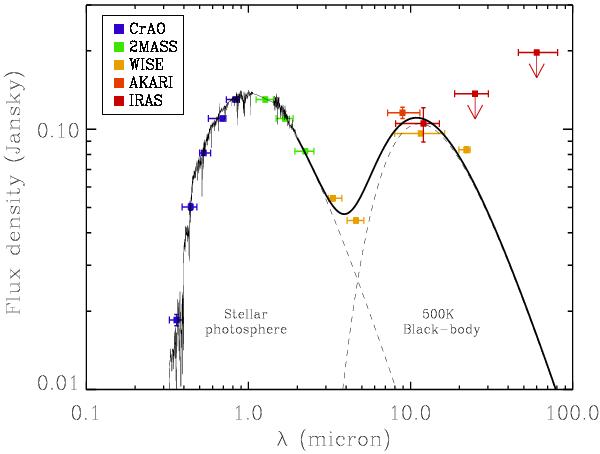
SED of RZ Psc. A K0 IV model photosphere (Pickles 1998) fits the optical and near-IR measurements shortward of 3 μm. Longward of 3 μm, the excess emission is markedly dominant and contributes 8% to the total source luminosity. The solid black line corresponds to the total flux of the stellar photosphere plus a single black-body curve of 500 K. Some uncertainties in the flux measurements are smaller than the plot-symbol. The errorbars in wavelength indicate the width of the filter, which corresponds to 50% of the transmission.
Current usage metrics show cumulative count of Article Views (full-text article views including HTML views, PDF and ePub downloads, according to the available data) and Abstracts Views on Vision4Press platform.
Data correspond to usage on the plateform after 2015. The current usage metrics is available 48-96 hours after online publication and is updated daily on week days.
Initial download of the metrics may take a while.