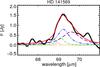
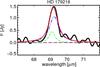
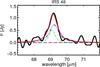
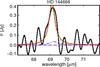
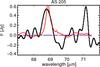
Fig. 8
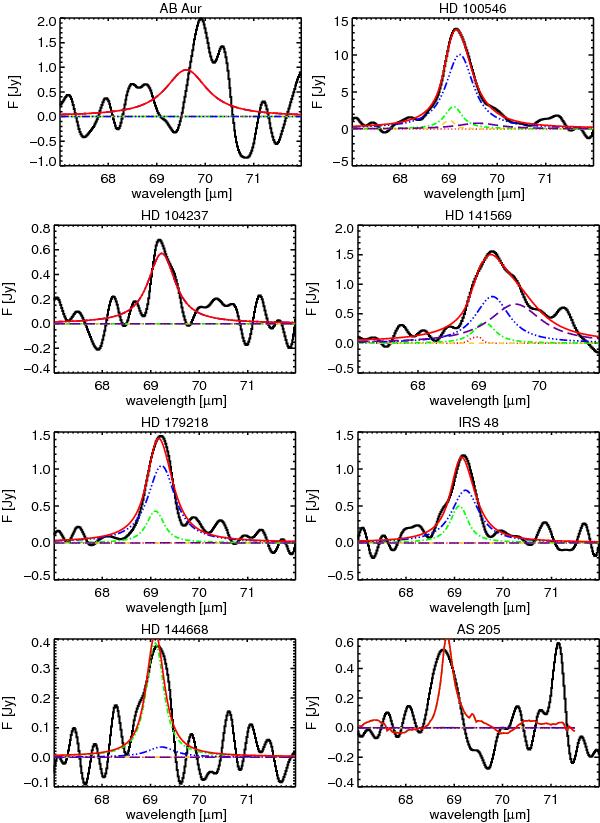
Results of fitting Eq. (2) with pure forsterite to the detected 69 μm forsterite emission bands. The measured spectrum is plotted as a black line, over-plotted with the best-fit model (continuous red line). The contribution of crystals at different temperatures is shown as follows: the dotted red line is the 50 K component, dashed yellow represents 100 K, dash-dotted green stands for 150 while the dashed-three-dot blue curve represents the 200 K sample and dashed purple the 295 K data. In all fits except for AS 205 we use the data from Suto et al. (2006) with the DHS shape model and a grain size of 0.1 μm. In AS 205 the position of the peak indicates very low temperatures so we used the laboratory data from (Koike et al. 2006) which include 8– (red, dotted) and 20 K (dashed, yellow) samples. The profile of AB Aur cannot be fitted with pure forsterite. In this case the admixture of some percent iron greatly improves the fit (see Fig. 9).
Current usage metrics show cumulative count of Article Views (full-text article views including HTML views, PDF and ePub downloads, according to the available data) and Abstracts Views on Vision4Press platform.
Data correspond to usage on the plateform after 2015. The current usage metrics is available 48-96 hours after online publication and is updated daily on week days.
Initial download of the metrics may take a while.