Fig. 4
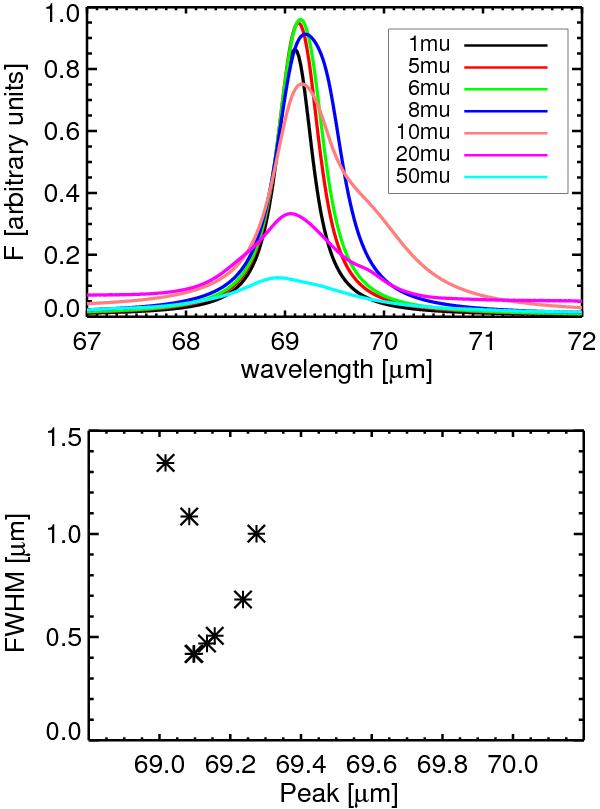
Effect of grain size on band shape. The top panel shows the profile of the 69 μm forsterite band at 150 K for different grain sizes. The profiles were computed using the optical constants from Suto et al. (2006) and the distribution of hollow spheres (Min et al. 2003). The lower panel shows the relation between peak position and FWHM of the profiles shown in the top panel. The asterisks in the lower panel correspond to the grain sizes in the upper panel, starting with 1 μm at the bottom.
Current usage metrics show cumulative count of Article Views (full-text article views including HTML views, PDF and ePub downloads, according to the available data) and Abstracts Views on Vision4Press platform.
Data correspond to usage on the plateform after 2015. The current usage metrics is available 48-96 hours after online publication and is updated daily on week days.
Initial download of the metrics may take a while.