Free Access
Fig. 13
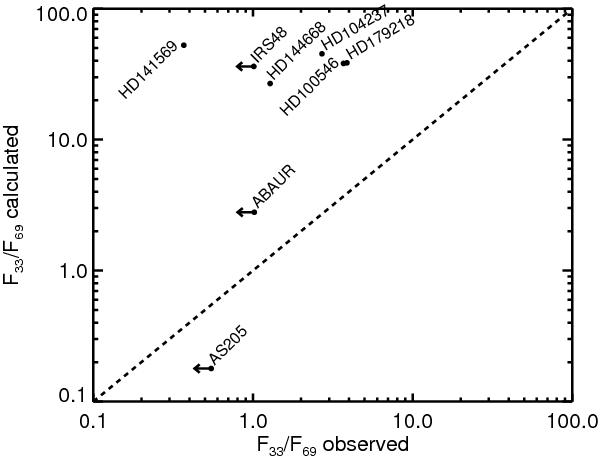
Comparison between the measured 33 μm over 69 μm peak fluxes in the forsterite bands and the expected ratio’s based on the derived mass averaged temperatures of the forsterite grains as listed in Table 4. The dashed line is the expected behaviour if no optical depth effects play a role.
Current usage metrics show cumulative count of Article Views (full-text article views including HTML views, PDF and ePub downloads, according to the available data) and Abstracts Views on Vision4Press platform.
Data correspond to usage on the plateform after 2015. The current usage metrics is available 48-96 hours after online publication and is updated daily on week days.
Initial download of the metrics may take a while.