Fig. 3
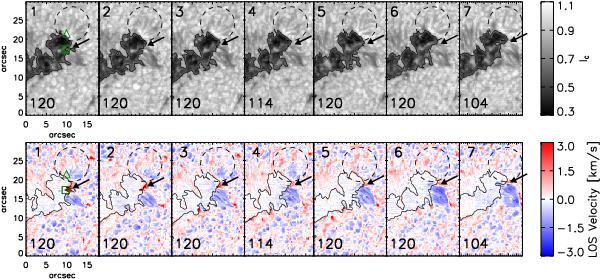
Regular Evershed flow and strong red-shifts in penumbrae from Hinode/SP observations. Top panels – continuum intensity at 630 nm. Bottom panels – bisector velocity derived at the 70% intensity level of the 6301.5 Å line. Panel numbers are indicated on the top left corner while the number of scan steps for each panel is shown at the bottom left. The start of the scanning sequence coincides with panel 8 of Fig. 2. The green triangle and square are centered on pixels whose Stokes profiles are shown in Fig. 4.
Current usage metrics show cumulative count of Article Views (full-text article views including HTML views, PDF and ePub downloads, according to the available data) and Abstracts Views on Vision4Press platform.
Data correspond to usage on the plateform after 2015. The current usage metrics is available 48-96 hours after online publication and is updated daily on week days.
Initial download of the metrics may take a while.