Fig. 2
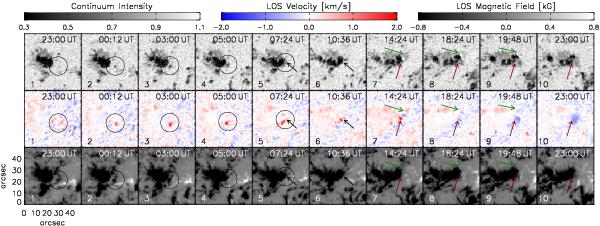
Formation of a penumbra in the decaying sunspot. First, second, and third rows correspond to HMI continuum intensity filtergrams, dopplergrams, and LOS magnetograms. All images were scaled according to their respective color bars shown above. For the dopplergrams, blue and red signify blueshifts and redshifts. The temporal evolution with a larger field of view covering a longer time span is shown in the movie available in the online edition. In that movie the square indicates the field of view of the panels show in this figure.
Current usage metrics show cumulative count of Article Views (full-text article views including HTML views, PDF and ePub downloads, according to the available data) and Abstracts Views on Vision4Press platform.
Data correspond to usage on the plateform after 2015. The current usage metrics is available 48-96 hours after online publication and is updated daily on week days.
Initial download of the metrics may take a while.