Fig. 1
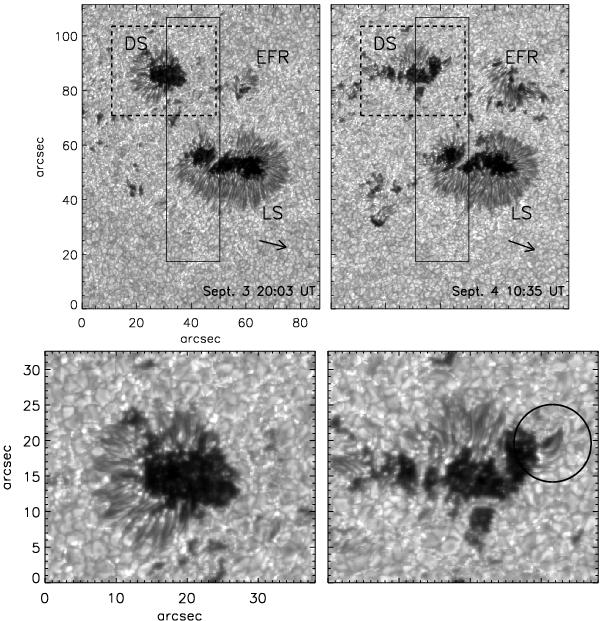
Active region NOAA 11283. Top: G-band images of the AR on September 3 (left panel) and 4 (right panel). The vertical rectangle corresponds to the field-of-view scanned by the Hinode/SP. LS-leading sunspot, DS-decaying sunspot, and EFR-emerging flux region. The bottom panels correspond to the region outlined by the dashed lines in the top panel. Solar east and north are to the left and to the top.
Current usage metrics show cumulative count of Article Views (full-text article views including HTML views, PDF and ePub downloads, according to the available data) and Abstracts Views on Vision4Press platform.
Data correspond to usage on the plateform after 2015. The current usage metrics is available 48-96 hours after online publication and is updated daily on week days.
Initial download of the metrics may take a while.