Fig. 7
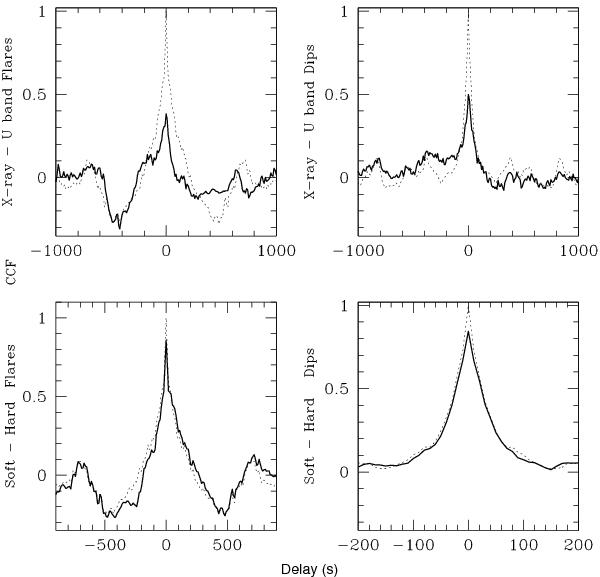
CCFs (solid lines) during flares (left) and dips (right). The CCF between the hard and the soft X-ray bands, taking as reference the soft range (ACF), are shown in the bottom panels. The CCFs between the total X-ray and U bands, taking as reference the X-ray band (ACF), are shown in the top panels. The ACF of each reference band is plotted with a dotted line.
Current usage metrics show cumulative count of Article Views (full-text article views including HTML views, PDF and ePub downloads, according to the available data) and Abstracts Views on Vision4Press platform.
Data correspond to usage on the plateform after 2015. The current usage metrics is available 48-96 hours after online publication and is updated daily on week days.
Initial download of the metrics may take a while.