Fig. 7
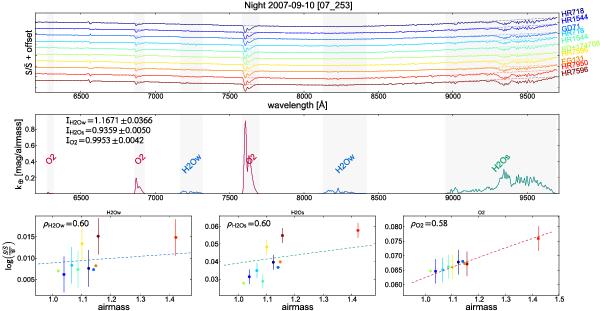
Example of a telluric correction spectrum computation for a typical night.
Top panel: all the reference normalized standard star spectra
 of the night and their continua C
(dashed lines). Middle panel: adjusted telluric template
intensities as function of their saturation. Bottom panels:
dependence with respect to airmass of
of the night and their continua C
(dashed lines). Middle panel: adjusted telluric template
intensities as function of their saturation. Bottom panels:
dependence with respect to airmass of  integrated over each group of lines
(shaded areas in middle panel). The dashed lines represent the airmass dependence
with a fixed saturation exponent.
integrated over each group of lines
(shaded areas in middle panel). The dashed lines represent the airmass dependence
with a fixed saturation exponent.
Current usage metrics show cumulative count of Article Views (full-text article views including HTML views, PDF and ePub downloads, according to the available data) and Abstracts Views on Vision4Press platform.
Data correspond to usage on the plateform after 2015. The current usage metrics is available 48-96 hours after online publication and is updated daily on week days.
Initial download of the metrics may take a while.