Fig. 18
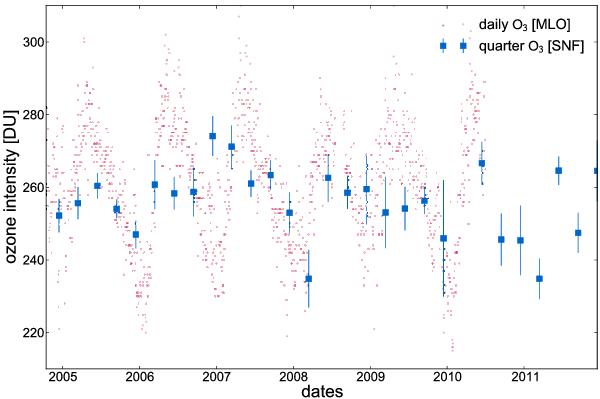
Total Column Ozone [Dobson units] from May 2004 to December 2011 for the SNfactory quarterly weighted averages (blue squares) and the Mauna Loa Observatory daily measurements (red points). The error bars on the SNfactory points represent the standard errors on the quarterly weighted averages.
Current usage metrics show cumulative count of Article Views (full-text article views including HTML views, PDF and ePub downloads, according to the available data) and Abstracts Views on Vision4Press platform.
Data correspond to usage on the plateform after 2015. The current usage metrics is available 48-96 hours after online publication and is updated daily on week days.
Initial download of the metrics may take a while.