Fig. 10
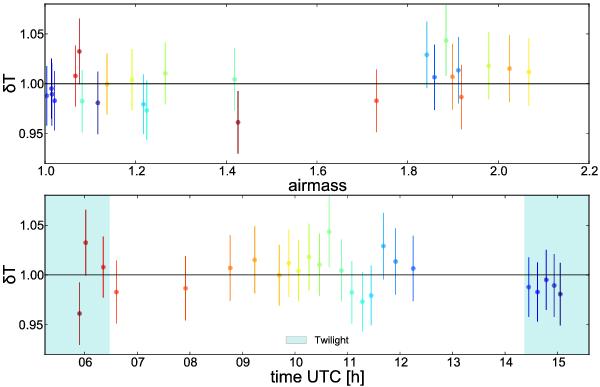
The grey extinction distribution, δT(ẑ,t), for a slightly non-photometric night (2010-06-28). The top panel shows δT(ẑ,t) as a function of airmass while the bottom panel shows δT(ẑ,t) as a function of time. Since the night is non-photometric most of the scatter is due to clouds, but there is some scatter due to achromatic extraction errors. Recall that we normalize by the mean of δT(ẑ,t) rather than the largest (fewest clouds) value.
Current usage metrics show cumulative count of Article Views (full-text article views including HTML views, PDF and ePub downloads, according to the available data) and Abstracts Views on Vision4Press platform.
Data correspond to usage on the plateform after 2015. The current usage metrics is available 48-96 hours after online publication and is updated daily on week days.
Initial download of the metrics may take a while.