Free Access
Fig. A.1
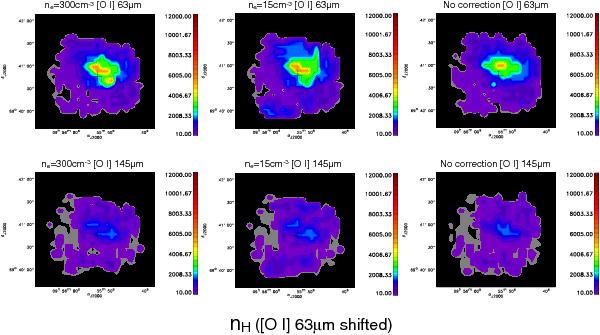
The PDR solution maps obtained for the gas density nH using the [OI] map at 63 μm shifted to match the steep gradient of the starburst region to that in the [CII] map, instead of the [CII] peak emission.
Current usage metrics show cumulative count of Article Views (full-text article views including HTML views, PDF and ePub downloads, according to the available data) and Abstracts Views on Vision4Press platform.
Data correspond to usage on the plateform after 2015. The current usage metrics is available 48-96 hours after online publication and is updated daily on week days.
Initial download of the metrics may take a while.