Fig. 9
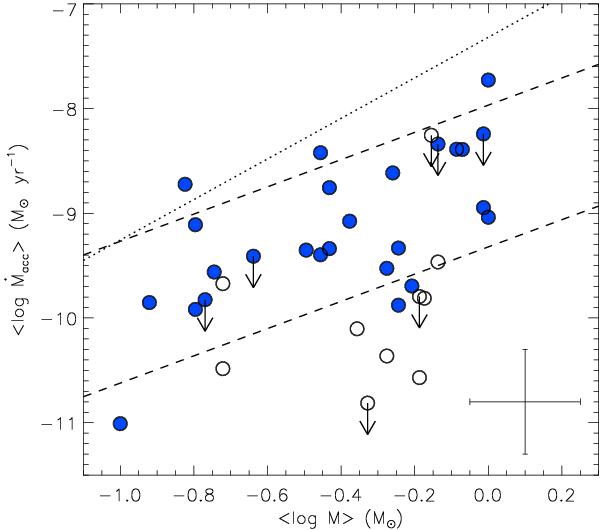
Mean mass accretion rate versus mean stellar mass. Symbols as in Fig. 8. The dashed lines mark minimum and maximum limits of Eq. (4), while the dotted line represents the mean relationship derived for Cha I by Antoniucci et al. (2011). Mean error bars are overplotted on the lower right corner.
Current usage metrics show cumulative count of Article Views (full-text article views including HTML views, PDF and ePub downloads, according to the available data) and Abstracts Views on Vision4Press platform.
Data correspond to usage on the plateform after 2015. The current usage metrics is available 48-96 hours after online publication and is updated daily on week days.
Initial download of the metrics may take a while.