Fig. 8
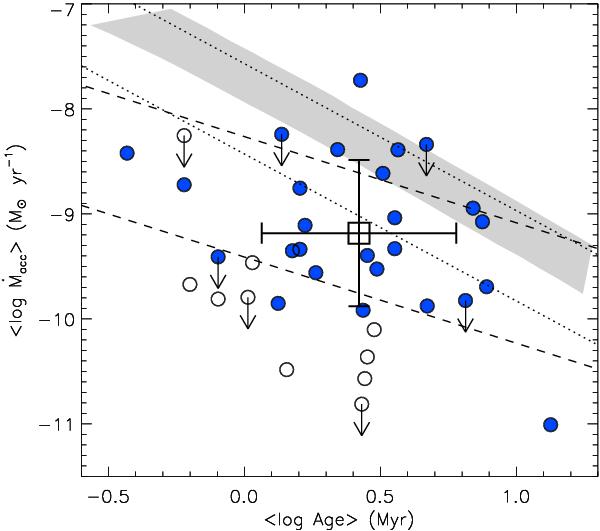
Mean mass accretion rate versus age. Open symbols represent the targets with mean EWHα ≤ 10 Å, while binaries are evidenced as upper limits. The big square represents the mean position of Cha II, taking into account the single stars with mean EWHα > 10 Å (vertical and horizontal error bars correspond to the standard deviations from the mean Ṁacc and age, respectively). The dashed lines mark minimum and maximum limits of Eq. (3), while dotted lines represent the analogous limits of the relationship derived for Cha I by Hartmann et al. (1998). The collection of viscous disk evolutionary models for solar-type stars with initial disk masses of 0.1−0.2 M⊙, constant viscosity α = 10-2, and viscosity exponent γ = 1 reported by Sicilia-Aguilar et al. (2010) is also displayed (filled region).
Current usage metrics show cumulative count of Article Views (full-text article views including HTML views, PDF and ePub downloads, according to the available data) and Abstracts Views on Vision4Press platform.
Data correspond to usage on the plateform after 2015. The current usage metrics is available 48-96 hours after online publication and is updated daily on week days.
Initial download of the metrics may take a while.