Fig. B.1
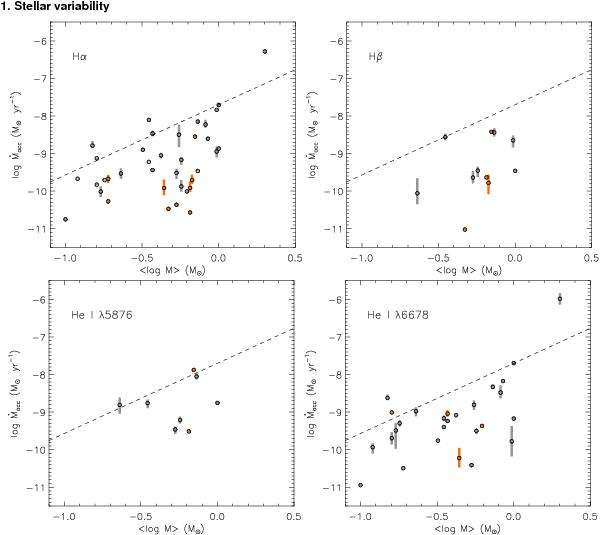
Mass accretion rates measured from the Hα (left top
panel), Hβ (right top panel),
He i λ5876 Å (left bottom panel), and
He i λ6678 Å (right bottom panel)
lines versus mass. Vertical bars connect the minimum and maximum values of
Ṁacc obtained per each star at different epochs.
Stars are divided into high Hα emitters
(EWHα > 10 Å;
grey bars) and low Hα emitters
(EWHα < 10 Å;
orange bars), i.e., stars where the line emission cannot be unambiguously
attributed to accretion activity, as it is most likely caused by chromospheric
activity. The dashed line shows the relation
 obtained by Herczeg & Hillenbrand
(2008) for Taurus members. The highest Ṁacc
values in the first and fourth panels refer to the early-type star DK Cha. The
lower number of points in the Hβ and He i plots is due
to two reasons: absence of the line in the given star or line out of the
wavelength range (see Table 5).
obtained by Herczeg & Hillenbrand
(2008) for Taurus members. The highest Ṁacc
values in the first and fourth panels refer to the early-type star DK Cha. The
lower number of points in the Hβ and He i plots is due
to two reasons: absence of the line in the given star or line out of the
wavelength range (see Table 5).
Current usage metrics show cumulative count of Article Views (full-text article views including HTML views, PDF and ePub downloads, according to the available data) and Abstracts Views on Vision4Press platform.
Data correspond to usage on the plateform after 2015. The current usage metrics is available 48-96 hours after online publication and is updated daily on week days.
Initial download of the metrics may take a while.