Free Access
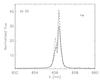
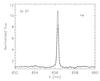
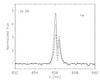
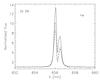
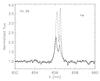
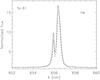
Fig. A.1
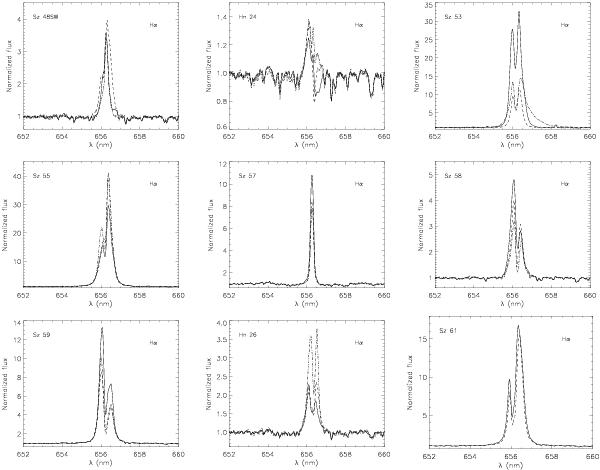
Examples of Hα emission line profile variations of nine stars. The fluxes are normalized to the continuum. The data refer to the FLAMES/GIRAFFE configuration. The solid/dashed/dash-dotted line represents the first/second/third observation, respectively.
This figure is made of several images, please see below:
Current usage metrics show cumulative count of Article Views (full-text article views including HTML views, PDF and ePub downloads, according to the available data) and Abstracts Views on Vision4Press platform.
Data correspond to usage on the plateform after 2015. The current usage metrics is available 48-96 hours after online publication and is updated daily on week days.
Initial download of the metrics may take a while.