Fig. 10
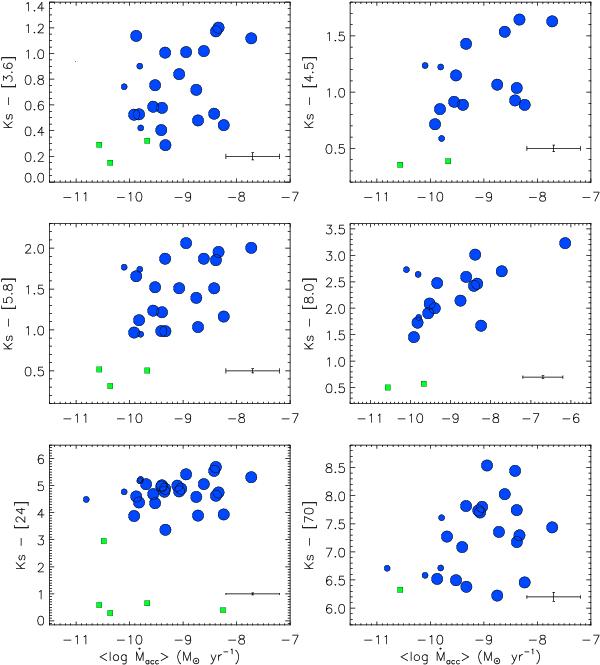
Infrared 2MASS-Spitzer colors versus mean mass accretion rates. Squares and dots correspond to Class III and Class II objects, respectively (see Table 7). Symbol sizes represent stars with EWHα < 10 Å (small squares and dots) and with EWHα > 10 Å (big dots). Mean error bars are overplotted on the lower right corner of each panel.
Current usage metrics show cumulative count of Article Views (full-text article views including HTML views, PDF and ePub downloads, according to the available data) and Abstracts Views on Vision4Press platform.
Data correspond to usage on the plateform after 2015. The current usage metrics is available 48-96 hours after online publication and is updated daily on week days.
Initial download of the metrics may take a while.