Fig. 1
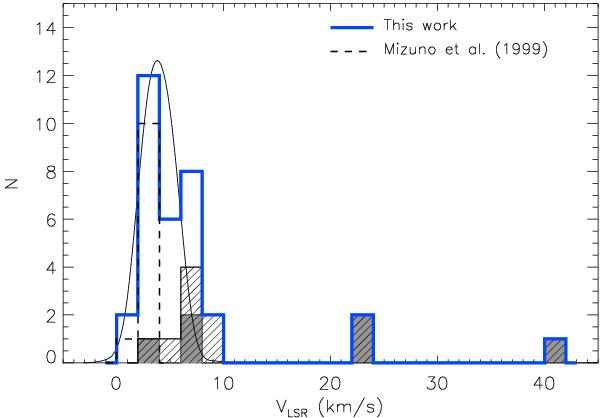
Average RV distribution in the LSR (solid thick line) of the Cha II PMS stars. The distribution of the gas derived by Mizuno et al. (1999) is overlaid (dashed line). The Gaussian fit to the PMS RV distribution is shown (thin line). The shaded histogram represents spectroscopic binary stars, while the hatched one marks the UVES observations. In the case of Hn 24 and Sz 54, where both UVES and GIRAFFE RVs were measured, we considered the UVES observations.
Current usage metrics show cumulative count of Article Views (full-text article views including HTML views, PDF and ePub downloads, according to the available data) and Abstracts Views on Vision4Press platform.
Data correspond to usage on the plateform after 2015. The current usage metrics is available 48-96 hours after online publication and is updated daily on week days.
Initial download of the metrics may take a while.