Fig. 1
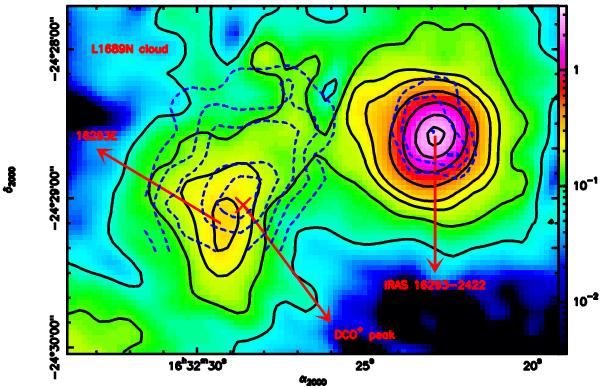
Continuum map at 1.3 mm convolved to 15′′ with black contours at 4%, 6%, 8%, 15%, 30%, 60%, and 90% of the peak located at the IRAS 16293-2422 position (6.7 Jy in a 1500 beam). Dashed blue lines show the distribution of the DCO+ 3–2 integrated intensity between 2.8 and 5 km s-1, with contour levels contour levels are 50%, 60%, 70%, 80% and 90% of the peak (integrated over velocities between 2.8 and 5 km s-1). The cross represent the position towards which H2D+ and D2H+ have been observed.
Current usage metrics show cumulative count of Article Views (full-text article views including HTML views, PDF and ePub downloads, according to the available data) and Abstracts Views on Vision4Press platform.
Data correspond to usage on the plateform after 2015. The current usage metrics is available 48-96 hours after online publication and is updated daily on week days.
Initial download of the metrics may take a while.